SQL Quality Control

Optimize SQL workloads
SQL Quality Control analyzes Db2 workloads, pinpoints areas for improvement, and provides recommendations to optimize SQL workloads and boost performance.
Improve Throughput and
Reduce Mainframe Costs
SQL Quality Control maximizes CPU savings within your SQL applications by identifying tuning opportunities and automatically proposing cost-saving solutions – no other product on the market has this autonomous capability.
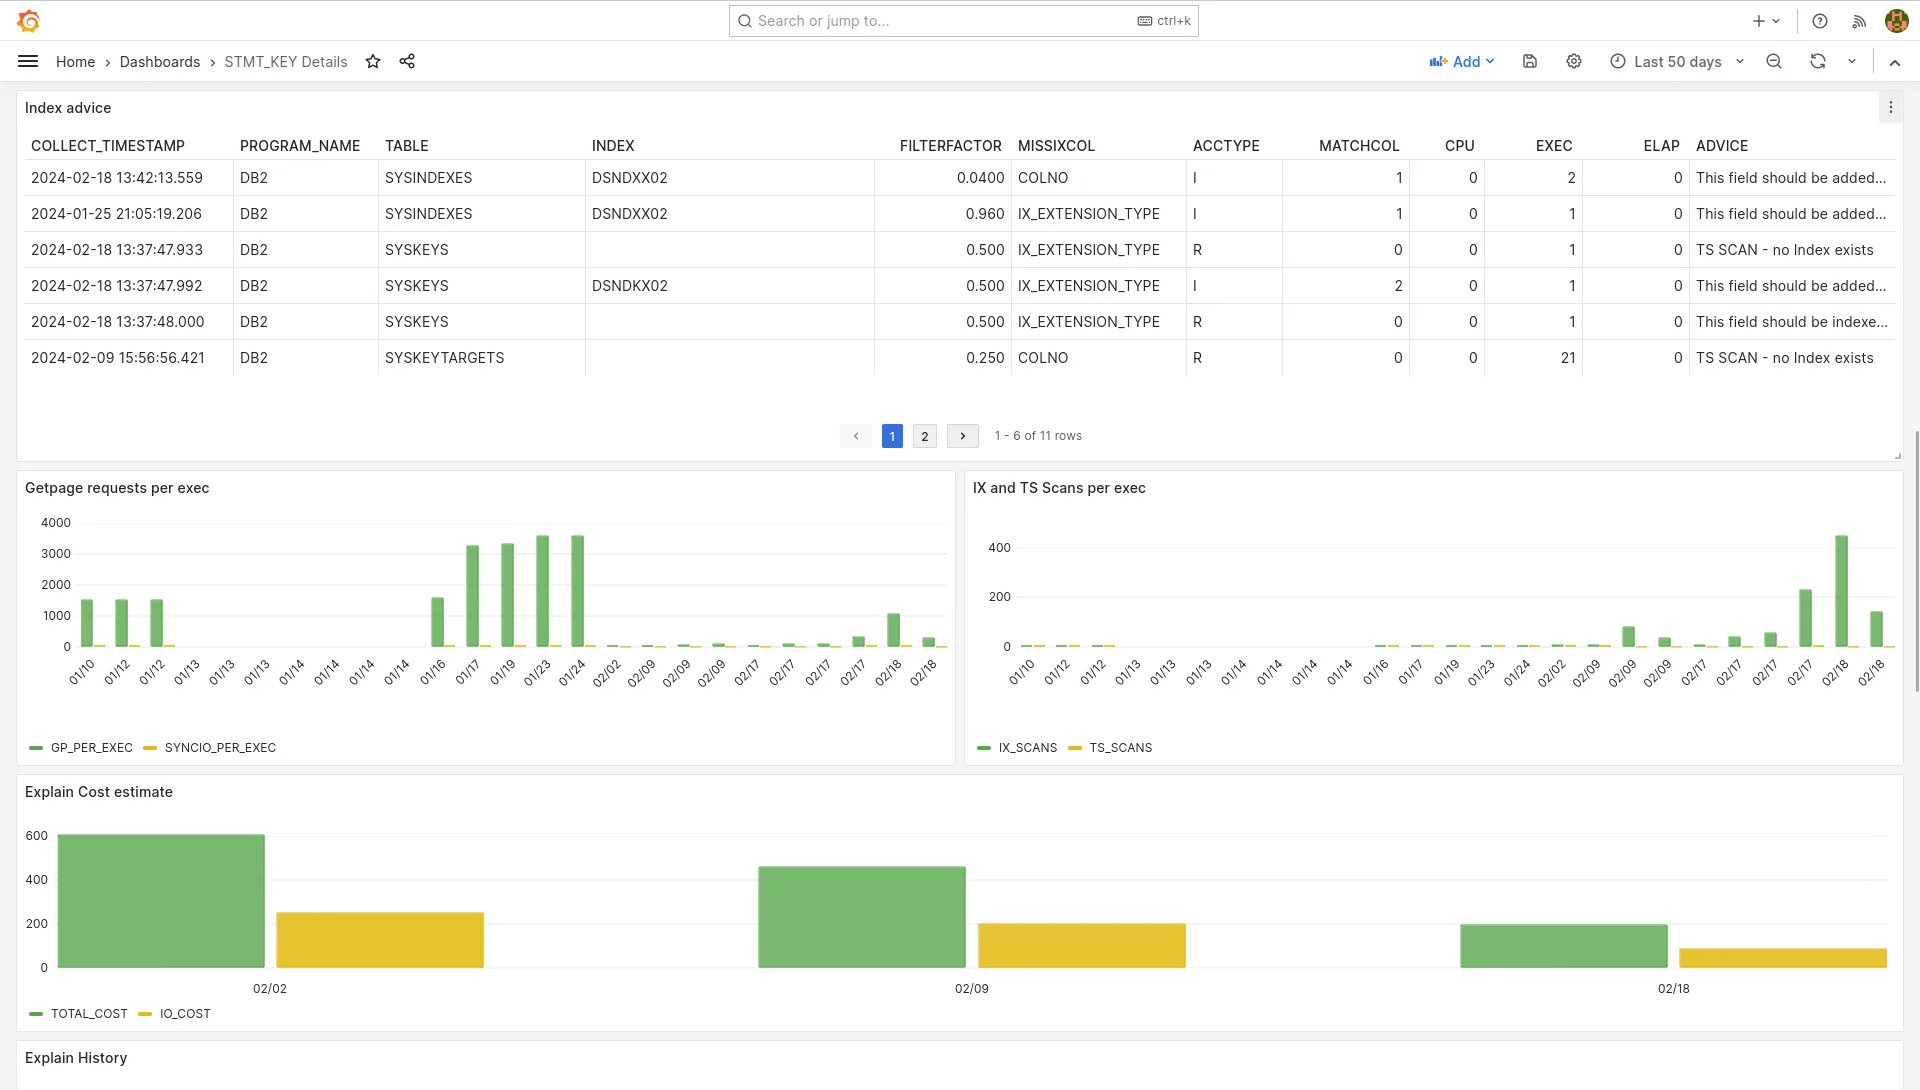
Gain a comprehensive view of your SQL environment. Track changes in SQL statements, monitor CPU consumption, identify unnecessary indices, and delve into historical performance data—all through an intuitive GUI powered by Grafana Dashboards.
Improve Throughput and
Reduce Mainframe Costs
Reduce Operating Costs
The primary factor affecting mainframe operating costs is the application workload. While advancements like zIIP processors enable cost reductions, the application-specific workload remains critical. SQL Quality Control addresses this by autonomously identifying tuning opportunities, such as missing indices. It collects comprehensive data and provides a precise overview of SQL statement changes.
Reduce Operating Costs
Key Features
Track changes in access paths over time.
Monitor growth rates in CPU consumption per SQL statement.
Identify unnecessary indices with insert activity.
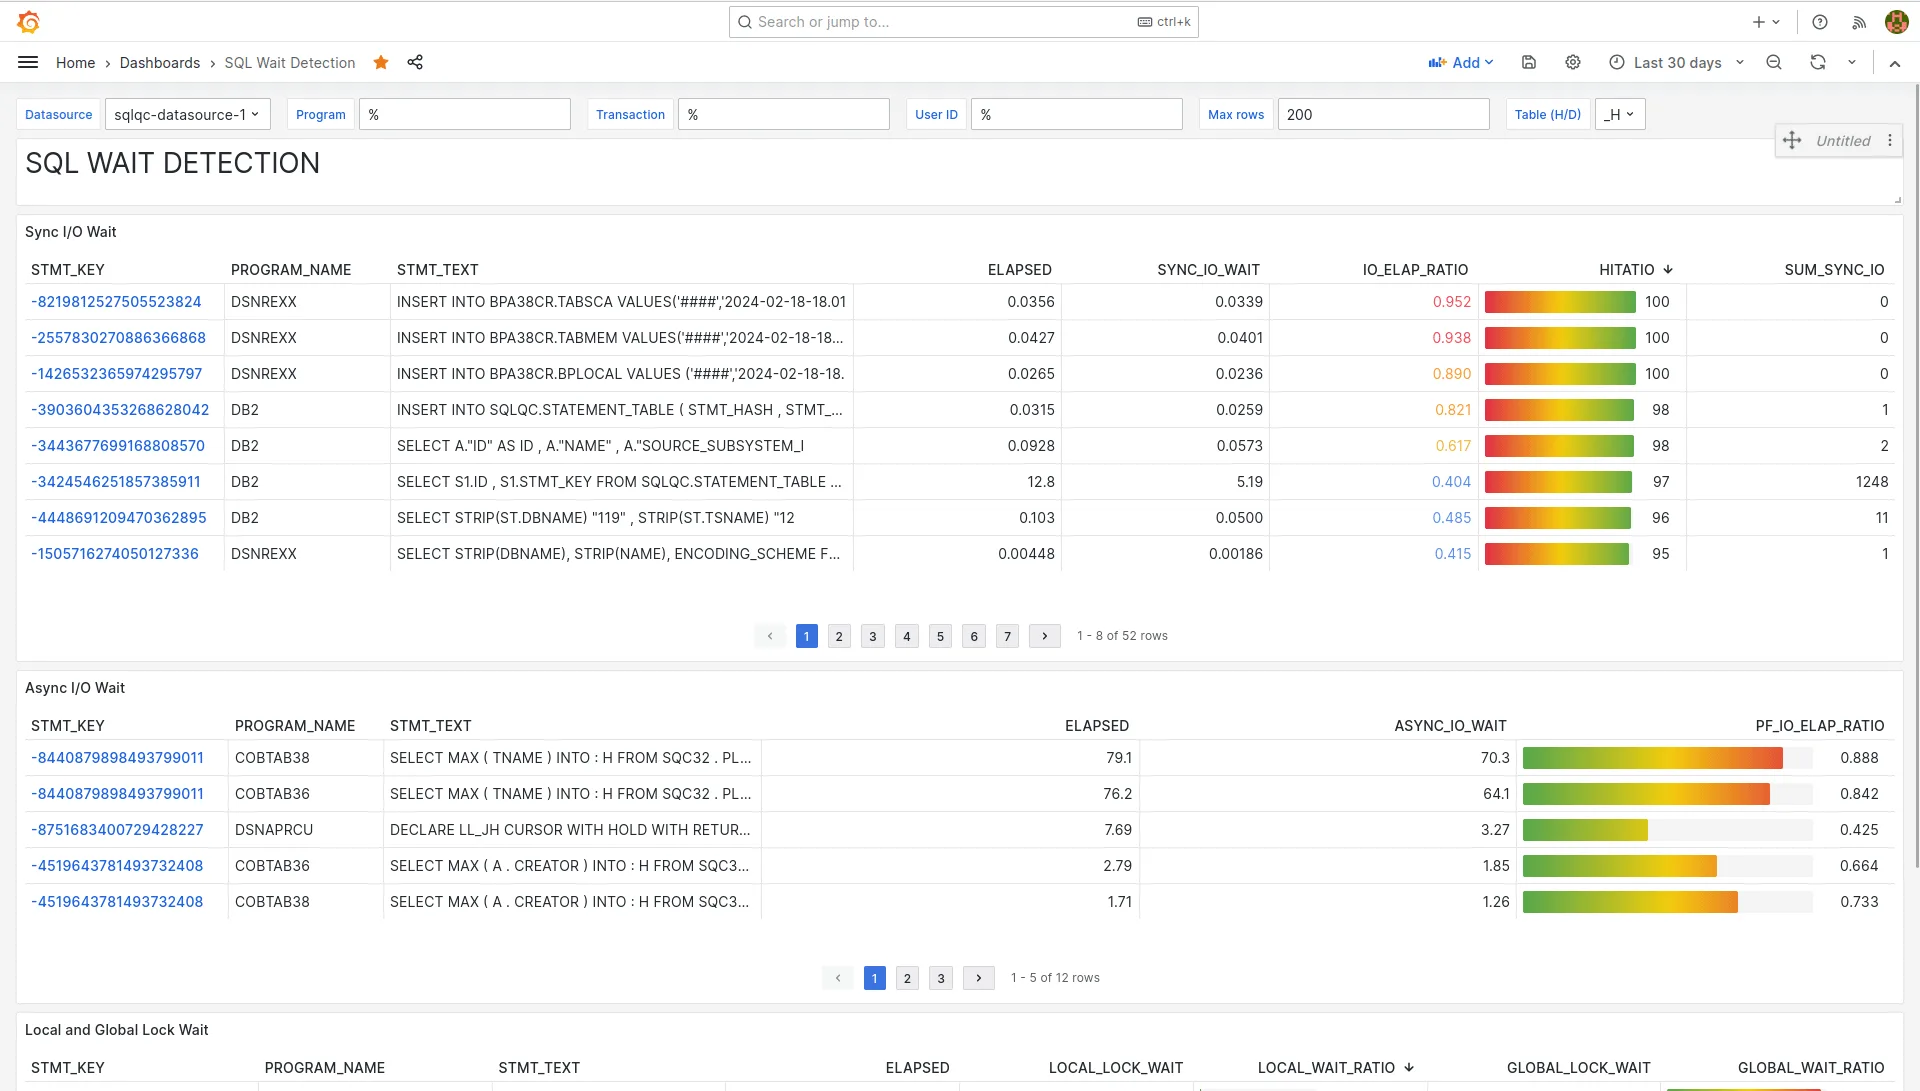
Access the historical data of each SQL statement, including CPU consumption and associated Class 3 wait times.
View the history of access paths for each SQL statement.
Key Features

Track every SQL over time
Monitor consumption figures and waits (IO, Lock, log). Keep track of access paths at any given time.
Modern GUI
for Easy Analysis
Grafana Dashboards clearly show which SQL statements have the highest costs and should be the focus of optimization efforts.
SQLQC pinpoints the most resource-intensive queries and gives recommendations for reducing consumption.
Modern GUI
for Easy Analysis

User Testimonial
from REWE
Clear Grafana evaluations are highly appreciated at REWE.
“Employees are motivated to review
CPU usage, assess SQL query performance,
and optimize their work with SQL Quality Control.”
– Vi An Lieu, Db2 Administration REWE digital GmbH
User Testimonial
from REWE

Focus on Peak R4HA
for Cost Reduction
Concentrate cost-saving efforts during the highest rolling four-hour average (R4HA), typically between 10:00 AM and 02:00 PM.
Pinpoint the primary contributors to CPU consumption during peak periods for focused optimization.
Focus on Peak R4HA
for Cost Reduction
Technical Details
Analyze long-term SQL statistics for tuning recommendations.
Detect and analyze access path changes.
Receive recommendations for missing or incorrectly defined indexes.
Access SQL History, Wait Analysis, Index Usage Statistics, and more.
Key Features

SQL Quality Control Components
Collects static and dynamic SQL statement statistics.
Explains collected SQL statements with access plan history.
Investigates workload and provides index recommendations.
Verifies automatic index proposals.
Grafana-based dashboard for comprehensive monitoring and analysis.
SQLQC Components


